







Interactive Stock Charts

Descripción de Interactive Stock Charts
Annoucement: v2.81 includes new data source for AlphaVantage for international market data.
New!! Candlestick Pattern Scanner and Indicator Reliability Lab added to allow Instant backtesting!
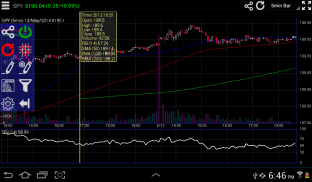
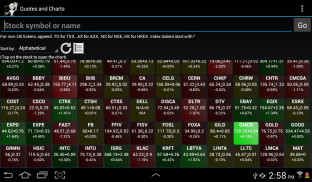
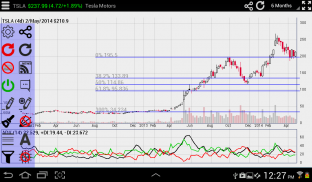
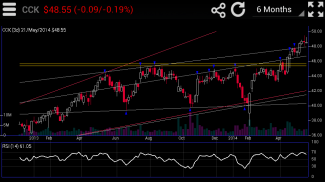
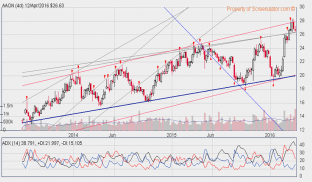
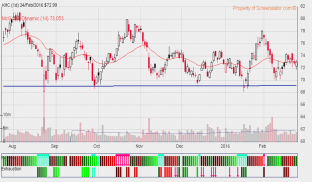
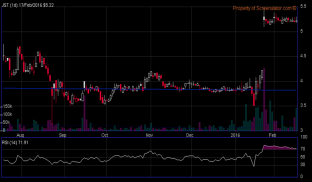
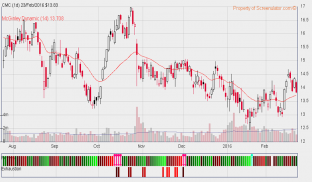
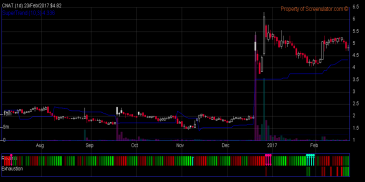
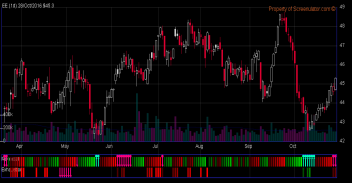
Interactive Stock Charts © is the most intuitive and advanced stock analysis charting app. You can freely adjust time frame and view technical information with touch of finger: scroll, pan and zoom on a beautiful candlestick charts with gesture and touch control. Swipe to scroll into historical analysis, pinch to zoom and change time frame, touch on price points to show detailed quotes and technical indicator values. You can also place real trade orders directly from the charts and portfolio view, through our partner Tradier Brokerage for US equity and options. Backed by Screenulator's patent pending automated chart pattern and trendline recognition engine, and industry's first 9,13 indicator completion screener! Interactive Stock Charts also comes with a powerful technical analysis tool set, Indicator Reliability Lab - in-chart backtesting tool and realtime RSS news feed to give you an edge over the market!
Using AI-based Deep Learning Neural Networks algorithms, Screenulator detects highly proftable chart patterns and reliable trendlines, TR/TD Indicators signals, as well as candlestick patterns. Backtested with 50+ years of historical big data, it ensures the you always have an edge against increasingly unpredictable markets! All Screenulator chart patterns are available on www.screenulator.com website for existing subscribers, see website for more member benefits.
Recent Additions:
Candlestick Pattern Scanner: http://www.screenulator.com/show_video.php?id=-XCcw46omgs
Indicator Reliability Lab:
About Trendlines:
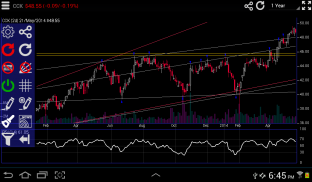
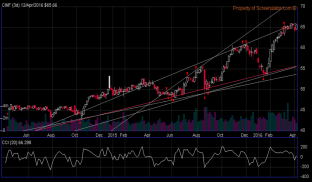
A trend line is a bounding line for the price movement of a security. A support trend line (or a bottom line) is formed when a securities price decreases and then rebounds at a pivot point that aligns with at least two previous support pivot points. Trendlines are considered by many expert traders to be the single most important tools in technical analysis. However, Support and Resistance breakout and Triangle patterns are just example of patterns formed by trendlines. This app automatically draws and screens for stocks with specific patterns.To learn more: http://www.screenulator.com/cgi-bin/v?pid=ref#trendlines
About Trend Reversal Indicator:
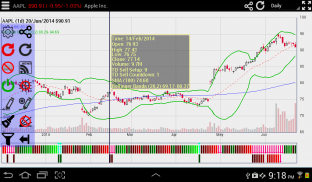
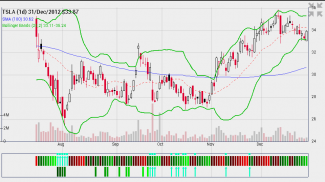
Screenulator's patent pending Trend Reversal and Exhaustion indicators combines 9,13 counting with trendline analysis to pinpoint trend pivots with color coded visual indicator. It has been shown to have an impressive record of identifying and anticipating turning points across the FX, bond, equity and commodity markets. Furthermore, the indicators provide signals not only on a daily chart but also intraday. It identifies when a trend is becoming, or has become, exhausted. This apps automatically identifies Trend Reversal, Trend Exhaustion, and Perfection criteria. It also calculates stoploss levels. To learn more: http://www.screenulator.com/show_video.php?id=TR_EXAMPLES
http://www.screenulator.com/cgi-bin/v?pid=ref#reversal
Classic TA indicators and overlays: RSI, MACD, SMA, EMA, Bollinger, Keltner band, Donchian Channel, Parabolic SAR, Ichimoku Cloud, McGinley Dynamic, SuperTrend, stochastic, ADX, Aroon, Chaikin, Ultimate, MFI, OBV, ATR, ADL, CCI indicators. Fibonacci Retracement and text annotation tools. Others will available upon requests.
Note: This app is free trial for 2 weeks or 100 usages whichever comes first.
Instruction Manual: http://www.screenulator.com/ischarts_faq.html
Desktop version: http://www.screenulator.com/ischarts_desktop.html
Anuncio: v2.81 incluye nueva fuente de datos para AlphaVantage para los datos del mercado internacional.
¡¡Nuevo!! Candlestick Pattern Scanner y Indicator Reliability Lab se agregaron para permitir el backtesting instantáneo.
Interactive Stock Charts © es la aplicación de gráficos de inventario de acciones más intuitiva y avanzada. Puede ajustar libremente el marco de tiempo y ver la información técnica con el toque de un dedo: desplazarse, desplazarse y acercarse a un bello gráfico de velas con gesto y control táctil. Deslice rápidamente para desplazarse al análisis histórico, pellizque para ampliar y cambiar el marco de tiempo, toque los puntos de precio para mostrar las cotizaciones detalladas y los valores del indicador técnico. También puede colocar órdenes comerciales reales directamente desde los cuadros y la vista de cartera, a través de nuestro socio Tradier Brokerage para acciones y opciones de los EE. UU. ¡Respaldado por el modelo de gráfico automatizado pendiente de patente de Screenulator y el motor de reconocimiento de línea de tendencia, y el primer indicador de finalización de indicador de 9,13 de la industria! ¡Interactive Stock Charts también viene con un poderoso conjunto de herramientas de análisis técnico, Indicator Reliability Lab - herramienta de prueba en el gráfico y transmisión de noticias RSS en tiempo real para darle una ventaja sobre el mercado!
Utilizando algoritmos de Deep Learning Neural Networks basados en inteligencia artificial, Screenulator detecta patrones de gráficos altamente rentables y líneas de tendencia fiables, señales de indicadores TR / TD, así como patrones de velas. Respaldado con más de 50 años de grandes datos históricos, ¡asegura que siempre tendrá una ventaja frente a mercados cada vez más impredecibles! Todos los patrones de gráficos de Screenulator están disponibles en el sitio web www.screenulator.com para los suscriptores existentes; consulte el sitio web para obtener más beneficios para los miembros.
Adiciones recientes:
Candlestick Pattern Scanner: http://www.screenulator.com/show_video.php?id=-XCcw46omgs
Laboratorio de confiabilidad del indicador: <¡Próximamente!>
Acerca de Trendlines:
Una línea de tendencia es una línea límite para el movimiento de precios de un valor. Una línea de tendencia de soporte (o una línea inferior) se forma cuando un precio de los valores disminuye y luego rebota en un punto de pivote que se alinea con al menos dos puntos de pivote de soporte anteriores. Las líneas de tendencia son consideradas por muchos operadores expertos como las herramientas más importantes en el análisis técnico. Sin embargo, la ruptura de soporte y resistencia y los patrones de triángulo son solo ejemplos de patrones formados por líneas de tendencia. Esta aplicación dibuja y pantallas automáticamente para acciones con patrones específicos. Para obtener más información: http://www.screenulator.com/cgi-bin/v?pid=ref#trendlines
Acerca del indicador de inversión de tendencia:
Los indicadores pendientes de revocación y agotamiento de tendencias de Screenulator combinan el conteo de 9,13 con el análisis de línea de tendencia para identificar pivotes de tendencia con un indicador visual codificado por color. Se ha demostrado que tiene un impresionante historial de identificación y anticipación de puntos de inflexión en los mercados de divisas, bonos, acciones y materias primas. Además, los indicadores proporcionan señales no solo en un gráfico diario sino también intradía. Identifica cuándo una tendencia se está convirtiendo, o se ha agotado. Esta aplicación identifica automáticamente los criterios de Inversión de tendencia, Agotamiento de tendencia y Perfección. También calcula los niveles de stoploss. Para obtener más información: http://www.screenulator.com/show_video.php?id=TR_EXAMPLES
http://www.screenulator.com/cgi-bin/v?pid=ref#reversal
Indicadores TA clásicos y superposiciones: RSI, MACD, SMA, EMA, Bollinger, banda Keltner, Donchian Channel, SAR Parabólico, Nube Ichimoku, McGinley Dynamic, SuperTrend, estocástico, ADX, Aroon, Chaikin, Ultimate, MFI, OBV, ATR, ADL , Indicadores CCI. Fibonacci Retracement y herramientas de anotación de texto. Otros estarán disponibles a petición.
Nota: Esta aplicación es de prueba gratuita durante 2 semanas o 100 usos, lo que ocurra primero.
Manual de instrucciones: http://www.screenulator.com/ischarts_faq.html
Versión de escritorio: http://www.screenulator.com/ischarts_desktop.html


